Class03
Compustat North America overview
Data: accounting and price data
Coverage: US and Canada
Time period: 1950 - present (Fundamentals Annual)
Frequency
Accounting data: yearly and quarterly
Price data: daily and monthly
Dataset structure
Fundamentals Annual
Fundamentals Quarterly
Security Daily
Security Monthly
Web access
Downlaod data from Compustat North America via WRDS web access.
Dataset: Compustat North Ameria - Fundamentals Annual
Time period: Jan 2000 to Dec 2020
Search the entire database
Screening variables
Consolidation Level: C
Industry Format: INDL
Data Format: STD
Population Source: D
Currency: USD
Company Status: Active (A) and Inactive (I)
Variables
gvkey
cusip
exchg
sic
fyear
at
seq
ebit
Output format
Tab-delimited text
Uncompressed
Date format: YYMMDDn8
Industry Format
INDFMT - FS - financial services (includes banks, insurance companies, broker/dealers, real estate and other financial services)
- INDL - other than financial services
gvkey |
fyear |
indfmt |
at |
capr1 |
|---|---|---|---|---|
007647 |
2020 |
FS |
2819627.0 |
13.5 |
007647 |
2020 |
INDL |
2819627.0 |
Identifiers
GVKEY - Compustat permanent firm level identifier
- They are permanent and never change
CUSIP - Current 9-digit
CUSIP (security level)- They can be changed.
CIK - Central Index Key used for SEC filings
Attention
Leading zeros of GVKEY
GVKEY is 6-digit character in string fromat. However, GVKEY contains numbers only and it will be recoganised as numerical values in some software by default. Therefore, the leading zeros will be dropped. For example, GVKEY 001050 might become 1050. This will cause matching problem if one dataset has 6-digit GVKEY and another one has GVKEY without leading zero.
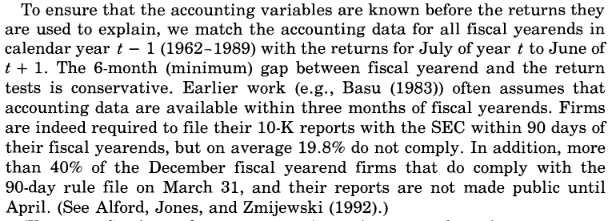
Datadate vs fiscal year
Datadate is the date of fiscal year end
Fiscal year (fyear)
Calendar Year |
Fiscal Year-end Month |
Fiscal Year |
|---|---|---|
2019 |
January |
2018 |
2019 |
February |
2018 |
2019 |
March |
2018 |
2019 |
April |
2018 |
2019 |
May |
2018 |
2019 |
June |
2019 |
2019 |
July |
2019 |
2019 |
August |
2019 |
2019 |
September |
2019 |
2019 |
October |
2019 |
2019 |
November |
2019 |
2019 |
December |
2019 |
Attention
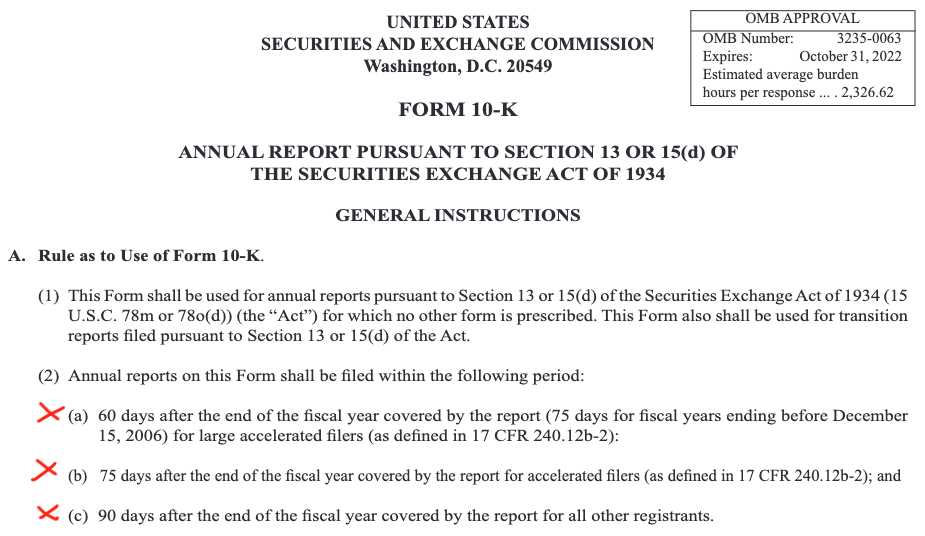
Keep in mind that we do not know the accounting information on datadate. The accounting numbers are public avaiable after companies release their financial reports.


Stock exchange code
11 - NYSE
12 - AMEX
14 - NASDAQ
0 - Subsidiary/Private
19 - OTC
Python
Import packages
import pandas as pd
import numpy as np
Import Compustat North America raw data
url = 'https://www.dropbox.com/s/qro99n7ngq0aztr/funda_raw.txt?dl=1'
funda_raw = pd.read_csv(url, sep='\t', low_memory=False)

# View first 5 rows and first 5 columns
funda_raw.iloc[:5, :5]
| gvkey | datadate | fyear | indfmt | consol | |
|---|---|---|---|---|---|
| 0 | 1004 | 20000531 | 1999 | INDL | C |
| 1 | 1004 | 20010531 | 2000 | INDL | C |
| 2 | 1004 | 20020531 | 2001 | INDL | C |
| 3 | 1004 | 20030531 | 2002 | INDL | C |
| 4 | 1004 | 20040531 | 2003 | INDL | C |
# Data types
funda_raw.info()
<class 'pandas.core.frame.DataFrame'>
RangeIndex: 199080 entries, 0 to 199079
Data columns (total 16 columns):
 #   Column    Non-Null Count   Dtype
---  ------    --------------   -----
 0   gvkey     199080 non-null  int64
 1   datadate  199080 non-null  int64
 2   fyear     199080 non-null  int64
 3   indfmt    199080 non-null  object
 4   consol    199080 non-null  object
 5   popsrc    199080 non-null  object
 6   datafmt   199080 non-null  object
 7   tic       198983 non-null  object
 8   cusip     198983 non-null  object
 9   curcd     199080 non-null  object
 10  at        161570 non-null  float64
 11  ebit      160025 non-null  float64
 12  seq       161564 non-null  float64
 13  exchg     198983 non-null  float64
 14  costat    199080 non-null  object
 15  sic       199075 non-null  float64
dtypes: float64(5), int64(3), object(8)
memory usage: 24.3+ MB
# Read the data again with consideration of the data type of gvkey
funda_raw = pd.read_csv(url, sep='\t', low_memory=False, dtype={'gvkey': str})

# View first 5 rows and first 5 columns
funda_raw.iloc[:5, :5]
| gvkey | datadate | fyear | indfmt | consol | |
|---|---|---|---|---|---|
| 0 | 001004 | 20000531 | 1999 | INDL | C |
| 1 | 001004 | 20010531 | 2000 | INDL | C |
| 2 | 001004 | 20020531 | 2001 | INDL | C |
| 3 | 001004 | 20030531 | 2002 | INDL | C |
| 4 | 001004 | 20040531 | 2003 | INDL | C |
# Data types
funda_raw.info()
<class 'pandas.core.frame.DataFrame'>
RangeIndex: 199080 entries, 0 to 199079
Data columns (total 16 columns):
 #   Column    Non-Null Count   Dtype
---  ------    --------------   -----
 0   gvkey     199080 non-null  object
 1   datadate  199080 non-null  int64
 2   fyear     199080 non-null  int64
 3   indfmt    199080 non-null  object
 4   consol    199080 non-null  object
 5   popsrc    199080 non-null  object
 6   datafmt   199080 non-null  object
 7   tic       198983 non-null  object
 8   cusip     198983 non-null  object
 9   curcd     199080 non-null  object
 10  at        161570 non-null  float64
 11  ebit      160025 non-null  float64
 12  seq       161564 non-null  float64
 13  exchg     198983 non-null  float64
 14  costat    199080 non-null  object
 15  sic       199075 non-null  float64
dtypes: float64(5), int64(2), object(9)
memory usage: 24.3+ MB
Clean dataset
funda_raw = funda_raw.sort_values(['gvkey', 'fyear', 'datadate'], ignore_index=True)
print(f'Number of obs: {len(funda_raw)}')

# Keep the most recent one if there are duplicates
funda = funda_raw.drop_duplicates(['gvkey', 'fyear'], keep='last').copy()
print(f'Number of obs after removing duplicates: {len(funda)}')

# Keep main stock exchanges
funda = funda[funda['exchg'].isin([11, 12, 14])].copy()
print(f'Number of obs after keeping main stock exchanges: {len(funda)}')

# Drop unnecessary variables
drop_vars = ['indfmt', 'consol', 'popsrc', 'datafmt', 'costat', 'curcd']
funda = funda.drop(columns=drop_vars)

# Drop if total asset and equity are not positive
funda = funda.query('at>0 & seq>0').copy()
print(f'Number of obs after requiring positive asset: {len(funda)}')
Number of obs: 199080
Number of obs after removing duplicates: 199080
Number of obs after keeping main stock exchanges: 125063
Number of obs after requiring positive asset: 101899
API reference: pandas.dataframe.sort_values
Firm-year obs in each stock exchange
funda['exchg'].value_counts()
14.0    57467
11.0    39778
12.0     4654
Name: exchg, dtype: int64
Seasonality of fiscal year end
funda['date'] = pd.to_datetime(funda['datadate'], format='%Y%m%d')
funda['month'] = funda['date'].dt.month
funda['month'].value_counts()
12    78281
6      5295
9      5055
3      4175
1      2690
10     1245
4      1088
8       918
5       913
7       900
2       699
11      640
Name: month, dtype: int64
ROA and ROE
funda['roa'] = funda['ebit'] / funda['at']
funda['roe'] = funda['ebit'] / funda['seq']
Asset growth
Generate lagged variables and calculate growth rate
funda = funda.sort_values(['gvkey', 'fyear'], ignore_index=True)
funda['lag_at'] = funda.groupby('gvkey')['at'].shift(1)
funda['lag_fyear'] = funda.groupby('gvkey')['fyear'].shift(1)
funda['ag'] = funda['at'] / funda['lag_at'] - 1
Check year gap
funda['fyear_diff'] = funda['fyear'] - funda['lag_fyear']
funda.query('fyear_diff>1')[['gvkey', 'fyear', 'lag_fyear', 'fyear_diff', 'ag']].head()
gvkey fyear lag_fyear fyear_diff ag 42 001038 2001 1999.0 2.0 0.076013 49 001045 2007 2003.0 4.0 -0.025878 50 001045 2014 2007.0 7.0 0.532008 283 001161 2009 2007.0 2.0 -0.214026 289 001161 2016 2014.0 2.0 -0.118397 Deal with gap
funda.loc[funda['fyear_diff']>1, 'ag'] = np.nan
Summary statistics
round(funda[['roa', 'roe', 'ag']].describe(), 3)
| roa | roe | ag | |
|---|---|---|---|
| count | 100932.000 | 100932.000 | 90153.000 |
| mean | 0.012 | 0.105 | 8.231 |
| std | 1.601 | 62.213 | 1456.622 |
| min | -44.088 | -16772.000 | -1.000 |
| 25% | 0.001 | 0.002 | -0.024 |
| 50% | 0.043 | 0.139 | 0.060 |
| 75% | 0.096 | 0.249 | 0.192 |
| max | 226.310 | 7305.250 | 409183.500 |
Deal with outliers
# Winsorising at 1% and 99% percentile
for i in ['roa', 'roe', 'ag']:
    funda['p1'] = funda.groupby('fyear')[i].transform(lambda x: x.quantile(0.01))
    funda['p99'] = funda.groupby('fyear')[i].transform(lambda x: x.quantile(0.99))
    funda.loc[funda[i]<funda['p1'], i] = funda['p1']
    funda.loc[funda[i]>funda['p99'], i] = funda['p99']
    funda = funda.drop(columns=['p1', 'p99'])

round(funda[['roa', 'roe', 'ag']].describe(), 3)
| roa | roe | ag | |
|---|---|---|---|
| count | 100932.000 | 100932.000 | 90153.000 |
| mean | -0.002 | 0.048 | 0.189 |
| std | 0.230 | 0.652 | 0.608 |
| min | -1.645 | -6.951 | -0.616 |
| 25% | 0.001 | 0.002 | -0.024 |
| 50% | 0.043 | 0.139 | 0.060 |
| 75% | 0.096 | 0.249 | 0.192 |
| max | 0.432 | 2.902 | 10.965 |
Stata
Import data from a url
local data_url "https://www.dropbox.com/s/qro99n7ngq0aztr/funda_raw.txt?dl=1"
import delimited "`data_url'", clear
List first five observations
l gvkey datadate at seq ebit in 1/5
Data types
describe
Specify data type when importing data
local data_url "https://www.dropbox.com/s/qro99n7ngq0aztr/funda_raw.txt?dl=1"
import delimited "`data_url'", stringcols(1) clear

describe

l gvkey datadate at seq ebit in 1/5
Keep the most recent one if there are duplicates
sort gvkey fyear datadate

by gvkey fyear: gen id = _n
by gvkey fyear: gen n = _N

keep if id == n
Keep main stock exchanges
keep if exchg==11 | exchg==12 | exchg==14
Drop unnecessary variables
drop indfmt consol popsrc datafmt costat curcd
Drop if total asset and equity are not positive
// Pay attention:
//  missing value (.) is larger than any other values
//  at>0 does not remove missing values
//  seq>0 does not remove missing values
//  This is different from Python

keep if at>0 & seq>0 & at!=. & seq!=.
Firm-year observations in each stock exchange
tab exchg
Seasonality of fiscal year end
tostring datadate, replace
gen date = date(datadate, "YMD")
format date %td

gen month = month(date)

tab month
ROA and ROE
gen roa = ebit / at

gen roe = ebit / seq
Asset growth
sort gvkey fyear

// Generate lagged variables and calculate growth rate
by gvkey: gen lag_at = at[_n-1]
by gvkey: gen lag_fyear = fyear[_n-1]
gen ag = at / lag_at - 1

// Check year gap
gen fyear_diff = fyear - lag_fyear

// Deal with gap
replace ag = . if fyear_diff>1
Summary statistics
summ roa roe ag
Deal with outliers
foreach i of varlist roa roe ag {
	bysort fyear: egen p1 = pctile(`i'), p(1)
	bysort fyear: egen p99 = pctile(`i'), p(99)
	replace `i' = p1 if `i' < p1
	replace `i' = p99 if `i' > p99
	drop p1 p99
}

sort gvkey fyear

summ roa roe ag